Key ecommerce data at your fingertips
Ecommerce is complex. Quantitative, comparative results are needed by all of us – business owners, ecommerce managers, service providers and account managers. The IRP Insights App provides this vital information.
Using anonymised data and IRP Trading Terminal (ITT) analyses, the IRP Insights App allows you to maintain control over everything in your business via very few touchpoints.
The IRP Insights App is about putting business owners and key ecommerce staff in control. This is an essential piece of technology that every business owner and ecommerce trading team member should use on a daily basis.
Logging in to the IRP Insights App
To log in to the IRP Insights App on your phone (or other device), follow these steps:
- Go to the following URL:
https://Your-IRP-Website/IRPApp/Login.aspx
- On the login screen, enter your IRP Admin Username and Password (these are the same permissions you use for logging in to the desktop version of your IRP):
- Tap the Login button.
- The first time you open the App, you should see a pop-up message that explains how to add the App to your home screen on your device. The exact message that you see depends on the type of device (iPhone, Android, etc.) and browser (Safari, Firefox, Chrome, etc.) that you are using. Here is a Firefox example:
This states: “To add this web app to the home screen open the browser option menu and tap on Add to homescreen”. You will also see other device-specific and browser-specific text.
- Close the pop-up message and you will see the Insights App home page. This is described in the sections that follow.
Home page
The first screen you see when you log in is the Insights App home page. This provides you with at-a-glance statistics about the overall performance of your online business.
Targets and projections
In the header of the home page you will see the following key statistics:
- This Year Target Sales: This shows the sales target agreed between you and your Account Manager.
- This Year Projected Sales: This is what your sales figure is projected to be if the current growth rates continue. If positive, this will be coloured green; if negative this will be coloured red.
Note: If you have the IRP B2B and EPOS functionality enabled on your IRP system, you can also swipe through Target Sales and Projected Sales for B2B and Retail (EPOS).
Current sales information
Right under the header you will see the following live key sales information:
- Current Value of Baskets: This shows the current value of baskets on your website and the number of customers at the basket stage.
- Current Value of Checkout: This shows the current value of items in the checkout stage of your website and the number of customers at the checkout stage.
- Current Value of Today's Orders: This shows the total number and value of sales for today, so far.
Tabs
You can select tabs for 'Total Sales' and 'Web' and, if you have the IRP B2B and EPOS functionality enabled on your IRP system, you will be able to view tabs for 'B2B' and 'Retail' sales data:
Note that you can drill down into EPOS sales to view sales by stock location:
Note: The sections that you see depend on the top-level tab that you are viewing (Total Sales, Web, B2B or Retail). The sections that follow describe what you see when you use the 'Web' tab.
Today's figures
At the top of the screen you will see the following key statistics from the IRP Trading Terminal (ITT):
- TODAY: This is the change in sales projection versus 24 hours ago. If positive, this will be coloured green; if negative this will be coloured red.
- Today's Sales: This shows the total number of orders placed today (online and telesales) and the total value of those orders.
- Theoretical Maximum: This is the total number and the total value of all online and telesales orders placed + all dropped baskets for the current day.
- TMR Ratio: 'Theoretical Maximum Revenue' Ratio – this is [the value of all orders placed (online and telesales)] / [the value of all orders placed (online and telesales) + dropped baskets] and expressed as a percentage.
- TMC Ratio: 'Theoretical Maximum Conversion' Ratio – this conversion rate is calculated from [the current total number of orders] / [the theoretical maximum number of orders] and expressed as a percentage. (The 'theoretical maximum number of orders' is based on [all current orders (online + telesales)] + [dropped baskets].)
Gross profit
This shows figures for the following: Today's Sales, Gross Profit, Marketing Spend and After Spend.
This month sales analysis
This shows the following key figures:
- This Month / Previous Year Sales: This shows the total value of sales this month of the previous year. (This will not be shown if the company has only recently come on board the IRP.)
- This Month Projected Sales: This is what your sales figure is projected to be if the current growth rates continue.
- This Month New Sales: This shows new sales this month.
- This Month Growth: This shows this month's growth expressed as a percentage. (A green infinity symbol will be shown if the company has only recently come on board the IRP.)
- Sales up to This Day: This shows the total sales this month up until today.
Previous month sales analysis
This shows the following key figures:
- Last Month, Last Year Sales: This shows the total value of sales last month of the previous year. (This will not be shown if the sales data is not available for the company.)
- Last Month Sales: This shows last month's total sales.
- Last Month New Sales: This shows new sales last month.
- Last Month Growth: This shows last month's growth expressed as a percentage. (A green infinity symbol will be shown if the sales data is not available for the company.)
Digital village performance
This shows the following key figures:
- Provider: This shows the name and logo of the Service Provider.
- Source: This shows the name of the Traffic Source.
- CPA%: This indicates how much it costs you in terms of marketing spend on each Traffic Source to acquire a customer, expressed as a percentage. For each month, the CPA% is calculated using the formula: Total Marketing Cost / Total Revenue * 100.
- Sales: This shows the total sales for this Traffic Source in the month.
- Sales %: This shows the percentage contribution of the Traffic Source to all sales.
This year sales analysis
This shows a graphical presentation of total revenue (this year and the previous year) plotted against each month of the year. Below the graph are filters for Day, Month and Year:
Underneath the graph you can see the following key figures:
- Current Stock: This shows the total value (Supplier Cost) of your current stock holding.
- CPA Target: This shows the target CPA% as agreed between you and your Account Manager.
- CPA: This indicates how much it costs you in terms of marketing spend to acquire a customer, expressed as a percentage. This is calculated using the formula: Total Marketing Cost / Total Revenue * 100.
- Sales to Date: This shoes the total revenue figure for this year.
- Proj Sales: This is what your sales figure is projected to be if the current growth rates continue.
Although not shown in the image above, the following stats are also available:
- Sales Opportunity: This is the IRP Trading Terminal's analysis of what you could achieve by maximising your use of traffic sources and conversion techniques. This figure is calculated as: (Lost Sales From Traffic + Lost Sales from Conversion + Actual Sales). The result is then rounded up to the nearest integer.
- Efficiency: This is an efficiency rating generated by the IRP Trading Terminal. It is calculated as the total revenue for the month divided by the total possible revenue for the month and expressed as a percentage: ((Total Revenue / Total Possible Revenue) * 100). (The 'possible revenue' figure is what you could have achieved in the current month had you maximised your use of traffic sources and conversion techniques and is calculated using a complex algorithm used by the Trading Terminal and includes analysis of sales and growth data from all IRPs.)
- Lost Revenue: This is the total value of sales that you are missing by not maximising your use of Traffic Sources conversion techniques.
Sales analysis last 30 days — top 10 products
This shows the following key figures:
- Product: This shows the product image and name as defined on the ModelsEdit.aspx page in IRP Admin.
- Quantity: This shows the number of each product that has been sold.
- Total: This shows the total sales value of each product that has been sold.
You can use the filter above the grid to filter the data for the previous day (1D), previous 7 days (7D) or previous 30 days (30D):
Sales analysis last 30 days — sales by country
This shows the following key figures:
- Country Flag: This shows the country's flag as defined on the ShippingCountryEdit.aspx page in IRP Admin.
- Country Name: This shows the country's name as defined on the ShippingCountryEdit.aspx page in IRP Admin.
- Orders: This shows the number of orders that have been placed from each country.
- AOV: This shows the Average Order Value for each country. The AOV is calculated using the formula: Total Revenue / Number of Orders.
- Total: This shows the total sales value from each country.
You can use the filter above the grid to filter the data for the previous day (1D), previous 7 days (7D) or previous 30 days (30D).
Sales analysis last 30 days — sales top 10 brands
This shows the following key figures:
- Brand Logo: This shows the brand image as defined on the BrandsEdit.aspx page in IRP Admin.
- Brand Name: This shows the brand name as defined on the BrandsEdit.aspx page in IRP Admin.
- Quantity: This shows the number of each brand that has been sold.
- Total: This shows the total sales value of each brand that has been sold.
You can use the filter above the grid to filter the data for the previous day (1D), previous 7 days (7D) or previous 30 days (30D).
Sales analysis last 30 days — sales top 10 categories
This shows the following key figures:
- Category Image: This shows the category image as defined on the CategoriesEdit.aspx page in IRP Admin.
- Category Name: This shows the category name as defined on the CategoriesEdit.aspx page in IRP Admin.
- AOV: This shows the Average Order Value for each category. The AOV is calculated using the formula: Total Revenue / Number of Orders.
- Total: This shows the total sales value of each category that has been sold.
You can use the filter above the grid to filter the data for the previous day (1D), previous 7 days (7D) or previous 30 days (30D).
Sales analysis last 30 days — sales summary
This shows the following key figures:
- Date: This shows the day of the month.
- Orders: This shows the number of orders that were placed on each day of the month.
- AOV: This shows the Average Order Value for each day of the month. The AOV is calculated using the formula: Total Revenue / Number of Orders.
- Total: This shows the total sales value for each day of the month.
You can use the filter above the grid to filter the data for the previous day (24HR), previous 7 days (7D) or previous 30 days (30D).
Customers — sales origin
This shows the following key figures for the current month:
- Domestic versus International %: This shows the percentage of domestic versus international customers.
- Number of Customers: This shows the total number of customers that have placed sales this month.
- Average Order Value: This shows the AOV of each customer. The AOV is calculated using the formula: Total Revenue / Number of Orders.
- Customer Lifetime Value: This is defined as the current average revenue generated by a customer this month. CLV is calculated using the formula: Total Revenue this month / Number of Distinct Customers this month. This does not include customers who have signed up but never purchased – it includes only purchasing customers.
- Size of Mailing List: This shows the total number of customers on your mailing list this month.
- % Orders Fulfilled: This is the percentage of orders fulfilled for each customer this month: (Total Number of Orders Made / Total Number of Orders Fulfilled) * 100.
Customers — device sales origin last 30 days
You will see a bar displaying the percentage of mobile versus desktop sales over the last 30 days:
Customers — sales by country last 30 days
You will see a pie chart displaying the sales totals for each country over the last 30 days:
To see the figures and countries, hover your cursor over each segment, for example:
Key Performance Indicators
This shows the following Key Performance Indicators (KPIs) for the most-recent month:
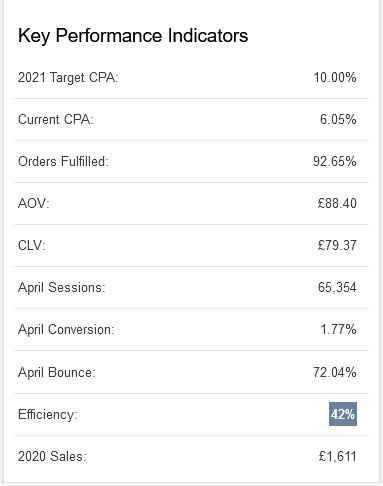
- CPA Target: This shows the target CPA% as agreed between you and your Account Manager.
- Current CPA: This indicates how much it costs you in terms of marketing spend to acquire a customer, expressed as a percentage. For each month, the CPA% is calculated using the formula: Total Marketing Cost / Total Revenue * 100.
- Orders Fulfilled: This is simply the percentage of orders fulfilled: (Total Number of Orders Made / Total Number of Orders Fulfilled) * 100.
- AOV: This is defined as the average monetary value of all orders. The AOV is calculated using the formula: Total Revenue / Number of Orders.
- CLV: This is defined as the current average revenue generated by a customer over their lifetime of making purchases, up to the month in question. CLV is calculated using the formula: Total Revenue up to the month in question / Number of Distinct Customers during that time frame (from the start of their IRP trading). This does not include customers who have signed up but never purchased – it includes only purchasing customers.
- [Most-Recent Month] Sessions: This is the total number of sessions that occurred in the most-recent month of data.
- [Most-Recent Month] Conversion: The Conversion Rate is calculated using the formula: Total Transactions / Total Sessions * 100. Note that sessions are used in this calculation and not visitors.
- [Most-Recent Month] Bounce: This is generally defined as the percentage of visitors who click on an ad or a search engine result, get through to a website, but then leave after viewing only a single page. Google defines this as “the percentage of single-page sessions (i.e. sessions in which the person left a site from the entrance page without interacting with the page)”. In email marketing campaigns, this statistic can also be defined as the number of emails that are undeliverable for some reason (for example, an invalid email address, a recipient's inbox was full and so forth).
- Efficiency: This value is generated by the IRP Trading Terminal. It is calculated as the total revenue for the month divided by the total possible revenue for the month and expressed as a percentage: ((Total Revenue / Total Possible Revenue) * 100). (The 'possible revenue' figure is what you could have achieved in the current month had you maximised your use of traffic sources and conversion techniques and is calculated using a complex algorithm used by the Trading Terminal and includes analysis of sales and growth data from all IRPs.).
- Previous Year Total Sales: This shows the total sales figures for the previous year.
Ecommerce manager & account manager
When you scroll right to the bottom of the screen you will see contact details for your Ecommerce Manager and your IRP Account Manager:
The IRP Insights App will display a default user image for the Ecommerce Manager if an Ecommerce Manager has not been set up against the company in IRP World. A message will also be displayed, informing you that there is no Ecommerce Manager data available in IRP World.
You can tap in these areas to open a new email to the person using your default email application or to place a phone call (if this feature is available on your device).
Summary statistics – footer
In the footer of the screen you will see the following key statistics:
- This Month of Previous Year Sales: This shows the sales you achieved in the same month of the previous year.
- This Month of Current Year Projected Sales: This is what your sales figure is projected to be if the current growth rates continue.
- Difference: This shows the difference between the above two figures, expressed in terms of the percentage change ((Current Year - Previous Year) / Previous Year) * 100. If positive, this will be coloured green; if negative this will be coloured red. (An infinity symbol will be shown if the company has not been active for more than a year.)
Left analysis screen
To view the left analysis screen, tap to expand the menu button (the ‘hamburger’ button) at the top-left of the App screen:
Here you will see the following information in the top section:
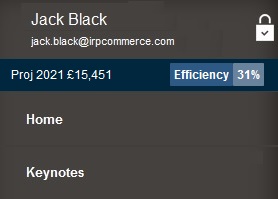
- Your name: Your Admin User name is shown right at the top of the menu. Underneath you will see your email address.
- Projected sales for this year: This is what your sales figure is projected to be if the current growth rates continue.
- Efficiency: This is an efficiency rating generated by the IRP Trading Terminal. It is calculated as the total revenue for the month divided by the total possible revenue for the month and expressed as a percentage: ((Total Revenue / Total Possible Revenue) * 100). (The 'possible revenue' figure is what you could have achieved in the current month had you maximised your use of Traffic Sources and conversion techniques and is calculated using a complex algorithm used by the Trading Terminal and includes analysis of sales and growth data from all IRPs.)
- Home: Tap here to return to the IRP Insights App home screen.
- Keynotes: This shows you all of the keynotes in your system, with separate tabs for Standard, Important and Critical notes.
In the IRP Digital Village section you will see the following information:
- Your IRP Agency: Tap to view the Agency's IRP World profile page.
- Your IRP Account Manager: This shows the name (and picture if available) of your Account Manager. You can tap to open a new email to the person using your default email application or to place a phone call (if this feature is available on your device).
- Traffic Sources: Each of the Traffic Sources that you use will be shown in a separate row. For each Traffic Source you will see the name of the Service Provider, the CPA% associated with the Traffic Source and the Sales generated by the Source.
Right at the bottom of the menu you will see the Logout button. For more details, see Logging Out of the IRP Insights App.
To close the left analysis menu and return to the IRP Insights App home screen, tap the menu button (or anywhere outside of the menu) or the 'Home' button.
Intelligence alerts
Intelligence Alerts from the IRP Trading Terminal (ITT) ('Trader') are there to highlight vital information relating to your online operation.
To view the Intelligence Alerts screen, tap the Trader ‘DeepAgent’ cogwheel icon at the top-right of the App screen; this will also have a red circle above it showing the number of Intelligence Alerts to view:
The Intelligence Alerts screen will expand and at the top of the screen you can see the following figures:
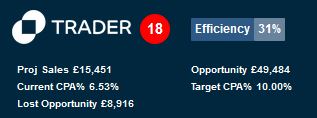
- Trader Intelligence Alerts: This shows the total number of Intelligence Alerts that are awaiting your attention.
- Efficiency: This is an efficiency rating generated by the Trading Terminal. It is calculated as the total revenue for the month divided by the total possible revenue for the month and expressed as a percentage: ((Total Revenue / Total Possible Revenue) * 100). (The 'possible revenue' figure is what you could have achieved in the current month had you maximised your use of traffic sources and conversion techniques and is calculated using a complex algorithm used by the Trading Terminal and includes analysis of sales and growth data from all IRPs.)
- Projected Sales: This is what your sales figure is projected to be if the current growth rates continue.
- Opportunity: This is the Trading Terminal's analysis of what you could achieve by maximising your use of Traffic Sources and conversion techniques. This figure is calculated as: (Lost Sales From Traffic + Lost Sales from Conversion + Actual Sales). The result is then rounded up to the nearest integer.
- Current CPA%: This is your current Cost Per Acquisition, calculated using the formula: Total Marketing Cost / Total Revenue * 100.
- Target CPA%: This is the target CPA% as agreed between you and your Account Manager.
- Lost Opportunity: This is the sum of all the individual Intelligence Alert 'Impact' values shown in the Alert messages.
There can be a huge number of possible Intelligence Alerts displayed in the main grid on this page, each with a significance level of Low, Medium, High or Critical:
At the bottom of the screen you can see the name of your ecommerce manager (with their profile picture if available - the IRP Insights App will display a default user image for the Ecommerce Manager if an Ecommerce Manager has not been set up against the company in IRP World - also a message will be displayed, informing you that there is no Ecommerce Manager data available in IRP World):
You can tap on the name to open a new email to the person using your default email application or to place a phone call (if this feature is available on your device). The idea here is that business owners may want to discuss the Alerts with their ecommerce manager.
To close the Alerts menu, tap the ‘DeepAgent’ cogwheel icon (or anywhere outside of the Alerts menu).
Logging out of the IRP Insights App
To log out of the Insights App:
- Tap to expand the menu button (the ‘hamburger’ button) at the top-left of the App screen:
- At the bottom of the menu, tap the Logout button:
