Notifications
You currently have no notifications!
Search
Menu
Close Menu

How can we help you?

Tell us more about your query, we'd be happy to help.
Reference:
How did you hear about us?:
 *
 *
 *
Northern Ireland eCommerce

Benchmarks 2024

KPIs for the eCommerce Community
Unlock Profits for Your Business and Your Merchants

2024 Northern Ireland eCommerce KPIs

eCommerce as a Market completely dwarfs AI. McKinsey's report shows that by 2040 eCommerce will be a 14-20 Trillion Dollarimage 
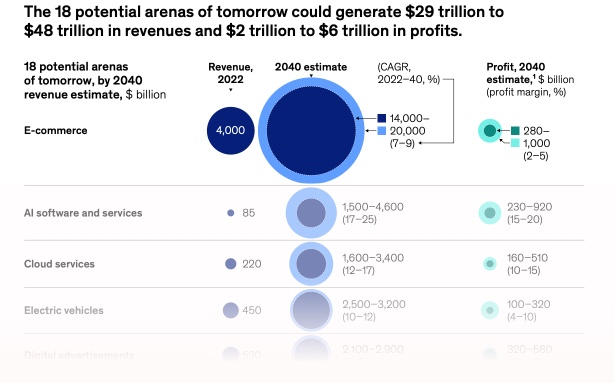
a Year Global sector. The downside in eCommerce is that low profit margins make it less attractive than AI for investors. On the upside eCommerce generates exports and regional trade and spreads economic benefit geographically and across the labour market in a way that no other industry does. 

Margins and Proft remain the big problem in eCommerce . A recent article suggested an incredible 70% of eCommerce companies go under in their first year.  Net Profit Margins remain very thin. IRPs surveyed Merchants reported 8% Net Profit - much higher than the national average.  For Northern Ireland based merchants the export opportunity continued to show in the numbers. Northern Ireland's unique position of dual EU and UK market access afforded by the Windsor Framework is supporting eCommerce.  Lower US tariffs applied to the UK may cement Northern Ireland's location as the gateway to two of the World's largest markets in the years to come.

In these KPIs IRP has crunched its data to provide eCommerce Benchmarks for Northern Ireland. With £2 Billion in eCommerce sales for Northern Ireland companies over the years - the 2024 Data provides reference KPIs for NI Merchants on Growth, Conversion, Traffic Costs, Channels, Markets and more for insights on eCommerce trading.

Check out IRP Market Data for live data at any time.

2024 NI Sales Growth

+11.77%
Merchant Growth
7.72%
Traffic Cost
Merchants again reported targeting an 8% Net Profit Margin

Northern Ireland Merchant KPIs

Average Order Value
Average Order Value
£100.34
Conversion Rate
Conversion Rate
1.84%
Traffic Cost
Traffic Cost
7.72%
Session Conversion Rate ranged from 0.56% to 5.28%

Top Export Countries

2nd
Flag
Ireland
24%
1st
Flag
United
Kingdom
60%
3rd
Flag
United States
8%
Flags
Merchants on IRP exported to 109 countries in 2024
UK, Ireland, USA, Canada, Australia, Denmark, France, Germany, Switzerland, United Arab Emirates

Top Marketing Channels

2nd
Channel
Email Marketing
7.1%
1st
Channel
Google PPC
59.3%
3rd
Channel
AWIN
5.5%
Facebook was 6th with only 0.2% of sales

Visitor Statistics

Average Order Value
Cost Per Visitor
£0.12
Conversion Rate
Revenue Per Visitor
£1.49
Traffic Cost
UK v International
57% v 43%
Average Order Value
Average Item Price
£32.95
Conversion Rate
Dropped Basket %
68%
Traffic Cost
Bounce Rate
38%
International sales drove NI's eCommerce growth

Sales by Device

Device Icon
Mobile
63%
Device Icon
Desktop
37%
Mobile shopping growth is slowing as a share
Some B2B markets are still Desktop centric

NI Traffic Spend 7.72% CPA

Traffic Spend largely dictated merchant profit.  
Growth Forecast
  • 1st Google PPC - 59.3% of Sales  11.31% CPA 🏆
  • 2nd Email Marketing - 7.1% of Sales  1.32% CPA 🏅
  • 3rd AWIN - 5.5% of Sales  6.79% CPA 🏅
  • 4th Bing & Yahoo PPC 2.8% of Sales - 10.64% CPA
  • 5th Webgains - 1.0% of Sales 9.28% CPA
  • 6th Facebook - 0.2% of Sales  65.06% CPA
NI merchants spent £7.72 on traffic for every £100 of sales
Above results based on Last Click Attribution

Top eCommerce Markets

2nd
Product
Pet Care
1st
Product
Fashion Clothing
& Accessories
3rd
Product
Cars &
Motorcycling
Thousands of Brands and Categories sold online in a wide variety of both large and niche markets

Category Sales Growth

3rd
Product
Pots & Planters
+282%
1st
Product
Pets & Fish
+896%
2nd
Product
Bikes & Tyres
+222%
Niche Markets are often growing faster due to less competition & a more engaged audience

The Coming Era of AI in eCommerce

Agencic AI
Will Agenic AI replace websites & topple Adwords & Facebook?
With Profit Margins as the problem, eCommerce is starting to embrace AI as a potential solution. AI is going to change the face of eCommerce - the only question is how much and how quickly?

AI has the potential to take out even the main pillars of eCommerce such as Adwords, Facebook and even websites themselves. HOW? - PEOPLE MIGHT ASK. The end game may be that consumers interact with "Agentic AI" and not websites to shop for products - interfacing with only this AI in '"conversational commerce".

AI will already know your size, your tastes, your location - and can find the products you want without you ever going to a "Website". More than this, for example, AI could show you wearing the clothes with personalised images and videos.  AI may lead to a totally disintermediated Buyer and Seller - where Merchants need only hold Inventory and supply AI with an EAN Number, Quantity in Stock and Price.
 
Watch AI closely - it has the power to change eCommerce

2025 NI Growth Projection

Growth Forecast
15 - 20% PREDICTION
As of May 2024 - NI eCommerce Sales growth is 16% YOY
IRP predicts that the overall NI eCommerce market will grow between 15% to 20% YOY in 2025. International sales and increased trade with Ireland will drive growth.

A £10 Billion Opportunity
Northern Ireland as an eCommerce Hub

Economy Report
17%
of the economy
180,000
Jobs by 2030
NICEe

Key Takeaways & Resources

Northern Ireland eCommerce sales continue to grow becoming a larger percentage of the economy. Growth was highly variable by Merchant and Owner Ambition remained the single biggest driver of individual Merchant success when matched with the right Technology and Service selection. 

Northern Ireland has a unique opportunity in eCommerce.  Will NI PLC take that opportunity?  Let's hope so!    

Next year's KPIs - it will be bigger and better. In the meantime IRP Market Data is published here every month.
IRP provides a SERVICE MARKETPLACE to drive efficiency by competition where Merchants to choose the best Service Providers based on performance.
Live Market Data
Today v Yesterday 0.01%
May 2025 v May 2024 17.19%
YTD 2025 v 2024 16.22%
Arts and Crafts 0.06%
Baby & Child 0.06%
Cars and Motorcycling 0.10%
Electrical & Commercial Equipment 0.34%
Fashion Clothing & Accessories 0.01%
Food & Drink 0.62%
Health and Wellbeing 0.50%
Kitchen & Home Appliances 0.15%
Pet Care 0.13%
Sports and Recreation 0.06%
Toys, Games & Collectables 0.22%

Copyright © 2025 IRP Commerce. Use of this website constitutes acceptance of the IRP World Acceptable Use Policy, IRP World Terms of Use, IRP Privacy Policy and IRP Cookie Policy

IRP Commerce Limited, Concourse 3, Catalyst, BT3 9DT, UK. Company Number: NI 041856. VAT Number: GB 888249658
A Deloitte Fast 50 Company eight times: 2010, 2011, 2012, 2013, 2014, 2018, 2019 & 2020